Research Methodology
Data Walk Menu
Data Walk
What is multisector collaboration?
What are multisector collaboratives?
What are the goals of multisector collaboratives?
What are collaboration dynamics?
How can multisector collaboration improve population health?
What is the ‘secret sauce’ for aligning sectors for improved population health?
Funding for this project has been made available through Aligning Systems for Health, led by the Georgia Health Policy Center with support from the Robert Wood Johnson Foundation.
Methods Summary
Research used a participatory approach and concurrent mixed methods to investigate the ways in which collaboration dynamics relate to outcomes in multisector collaboratives (MSCs). The study sample includes 22 health-focused MSCs (Accountable Communities of/for Health) in Washington and California and their participants. Primary data were collected with surveys, interviews, focus groups, and meeting observations from June 2020 through September 2021. Documents were collected for years 2015 through 2020 and secondary demographic data on the populations served by ACHs in the study sample were collected for years 2018 through 2020. Quantitative and qualitative data were analyzed using multiple techniques. Taken together, the multiple data sources used across a mid-sized sample of MSCs (n=22) and MSC participants (n=642) provided the evidence needed to explore linkages between collaboration dynamics and outcomes in health-focused MSCs.
Research Questions
- How can elements of an MSC’s local context and collaboration dynamics be combined, enhanced, or mitigated to increase the likelihood of achieving positive systems change, improved equity, and collaborative sustainability?
- When do certain configurations work, for whom, why, and under what conditions?
Research Design
Participatory: Collaboration and engagement with MSC participants, funders, and policy makers.
PHIL worked with MSCs, funders, government agencies, academic institutions, and other researchers to ensure the research project was designed to be as useful and relevant as possible. When we got to the sense making and reporting stage of the project, we worked with a group of Thought Partners to ensure findings were shared in an accessible and impactful way.
Realist: What works for who, when, where, and why?
We wanted our research to be grounded in a realistic, applicable understanding of diverse communities. To ensure that our work could be translated across different community settings, we asked: What works for who, when, why, and where?
Mixed methods: Concurrent quantitative and qualitative data collection and analysis.
We employed both qualitative and quantitative techniques to gain an understanding of the magnitude, directionality, and reasons for observed relationships. We collected data via surveys, interviews, meeting observations, focus groups, websites, documents, and public datasets like County Health Rankings and the American Community Survey. We analyzed data using multiple quantitative and qualitative techniques.
Research Setting
Multisector collaboration can help align sectors and systems for improved health. One approach to multisector collaboration is ACH model. ACHs are community-based partnerships formed across a variety of sectors, such as health care, housing, social services, public health, employment training, and economic development that all share a vision and responsibility for the health of the community.2,3 We chose to learn about multisector collaboration from ACHs because of their demonstrated progress toward transforming systems soon after implementation.4
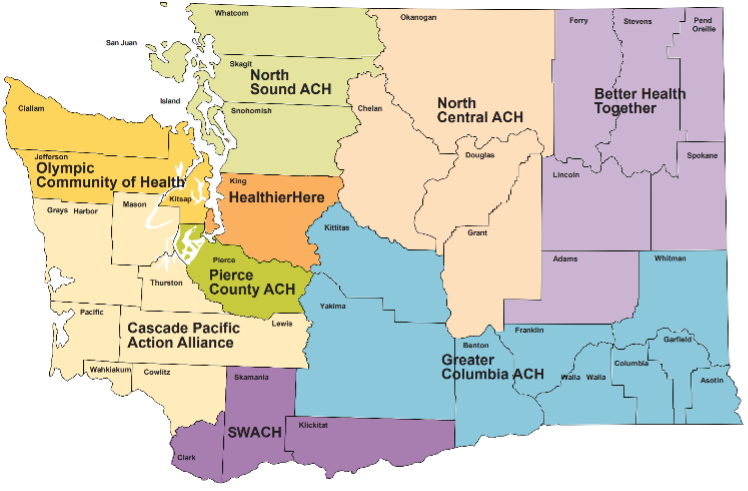
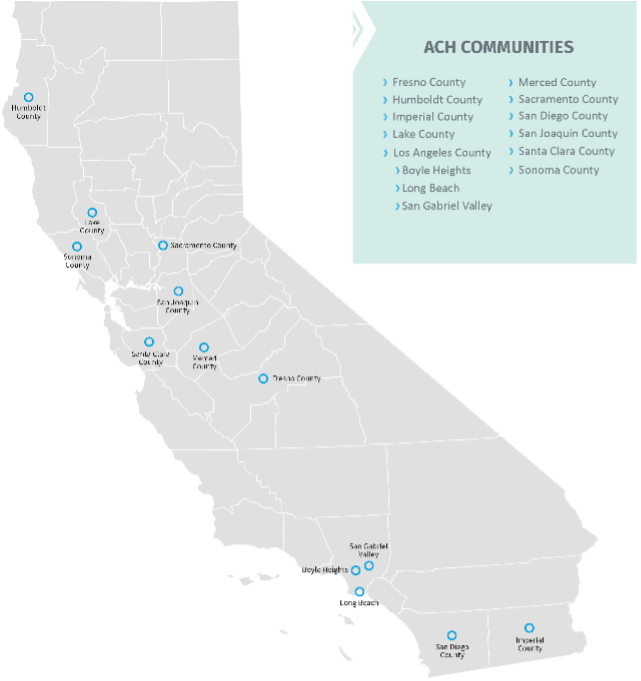
The study population includes 22 ACHs in Washington (n=9 ACHs, 383 participants) and California (n=13 ACHs, 259 participants). Figures 1 and 2 show the geographic location and coverage of the 22 ACHs included in the study.
Figure 1. ACHs in Washington State

Figure 2. ACHs in California State

Data Collection
Data were collected under the Public Health Institute’s IRB #I20-008. Primary and secondary data sources were used as evidence in this study. Primary data sources include surveys and interviews. Secondary data sources include meeting agendas and minutes, team governing documents (charters and bylaws), annual reports, evaluation reports, initiative websites, collaborative governance planning documents (theory of change, logic model, strategic plan, etc.), and publicly available datasets (American Community Survey, America’s Health Rankings, County Health Rankings).
Interview and Focus Group Sample
Preliminary interviews were conducted with ACH staff to learn about individual communities, gain an improved understanding of how collaboration dynamics work in the ACH context, and to validate the importance of the focal outcomes of study (systems change, improved equity, collaborative sustainability). At least two staff from each of the 22 ACHs were invited to participate in a preliminary interview. ACH staff were sent up to two reminder emails if they were not responsive to the initial invitations. Preliminary interview recruitment resulted in 19 interviews conducted with 30 individuals representing 15 ACHs.
From the full study sample of 22 ACHs, a smaller, diverse sample of six ACHs were invited to participate in a deep dive.5 When selecting ACH communities for the diverse sample, key variables of consideration included initiating leadership, geographic scale, funding levels, population density, average annual income, and percentage of the region’s population that is uninsured. The selection of a heterogeneous sub-sample of ACH communities for in-depth inquiry was intended to optimize external validity of the study.6 Participating deep dive ACHs were asked to refer a minimum of six individuals to participate in key informant interviews and focus groups, including one representative of each of the following groups: ACH backbone organization, tribal nations or other Native American/Alaska Native (NA/AN) communities, community residents, social services sector, public health sector, and health care sector. Table 1 provides an overview of group representation of the full interview and focus group sample.
Table 1. Demographics of Interview & Focus Group Sample

Survey Sample
Survey findings draw on 596 responses from individuals representing 20 ACHs. Individuals participated as community representatives (n=61), tribal representatives (n=11), organization representatives (n=431), and ACH staff (n=93). Survey results are more representative of Washington (n=345 respondents) than California (n=251 respondents). Response by ACH ranged from three to 88 respondents, with an average of 30 respondents per ACH. Survey response rate ranged from 20% to 47% across ACHs. Table 2 provides an overview of key demographic characteristics of the survey sample.
Table 2. Demographics of Survey Sample

Document Sample
A purposive sample of documents was collected for all 22 ACHs and included all available group charters and bylaws, planning documents (logic models, strategic plans, theories of change), annual reports, and meeting agendas and minutes. Most documents were publicly available on ACH websites. Some documents were obtained through other means, such as survey respondent document upload or research stakeholders sharing relevant documents during informal interactions. Documents were collected for all available years from 2014 through 2020. A total of 1,796 were collected across the 22 ACHs, with anywhere from six to 658 documents collected for a single ACH. On average, 82 documents were collected for each ACH. Documents were more readily available for Washington ACHs (average of 135 documents per ACH) than California ACHs (average of 45 documents per ACH).
Process Tracing Case Selection
For process tracing, a subset of typical cases was identified using survey data. A typical case is one where “the hypothesized cause, outcome, and contextual conditions are all present.”7 The hypothesized cause of ACH activities (i.e., initiation of the ACH) were present in all cases. The presence of contextual conditions and outcomes was determined using survey data. A sample of qualitative data were drawn from the full dataset and analyzed for the three ACHs with the highest levels of each outcome (systems change, equity, sustainability), based on survey response across 20 ACHs. Multiple cases were traced for each outcome so that cross-case comparisons could be made.
Data Analysis
Primary analytic techniques for hypothesis testing include:
- Process tracing to explore how collaboration dynamics can act as causal mechanisms for achieving outcomes.3
- Structural equation modeling (latent path analysis) to understand the relationships among observed variables, latent variables, and multiple dependent variables.8
We performed a variety of additional analyses to better understand strength of themes in qualitative data, associations between variables in quantitative data, differences across groups, and validity of measurement constructs including:
- Descriptive statistics
- Constant comparison analysis
- Exploratory and Confirmatory Factor Analysis
- Analysis of variance (ANOVA)
- Multiple regression analysis
Conceptual Lenses
PHIL’s Aligning Systems for Health research used three primary frameworks to study MSCs: 1) The Framework for Aligning Sectors; 2) Integrative Framework for Collaborative Governance; 3) Common Framework for Assessing ACHs.
1. Framework for Aligning Sectors
The Framework for Aligning Sectors helped us understand how health-focused cross-sector collaboration is theorized to work. This framework guided research question and hypothesis development.

Source: Georgia Health Policy Center, 2021,9 where arrows represent the adaptive factors (i.e., community voices, equity, trust, power dynamics) and gears represent the core components (i.e., shared purpose, data, governance, financing) that together generate outcomes of aligning.
2. Integrative Framework for Collaborative Governance
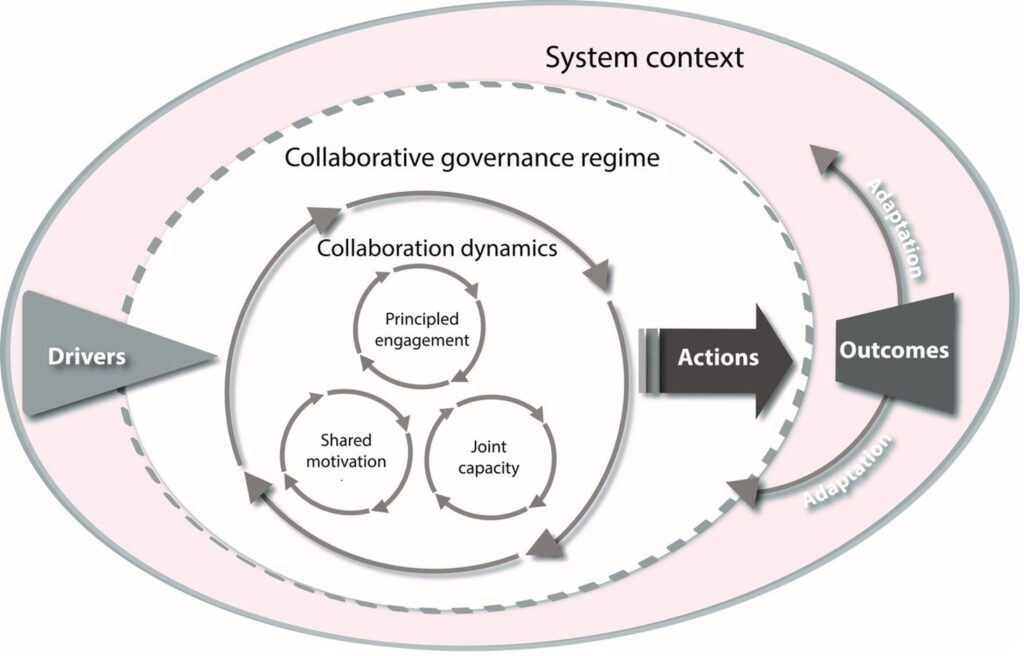
The Integrative Framework for Collaborative Governance guided our understanding of how large-scale cross-boundary collaboration can be measured and is expected to work.

Source: Emerson and Nabatchi, 2015,10 where collaborative systems (i.e., ACHs, MSCs, collaborative governance regimes) navigate their system context to generate collaboration dynamics that produce the actions that lead to collaborative outcomes.
3. Common Framework for Assessing Accountable Communities for Health (ACHs)
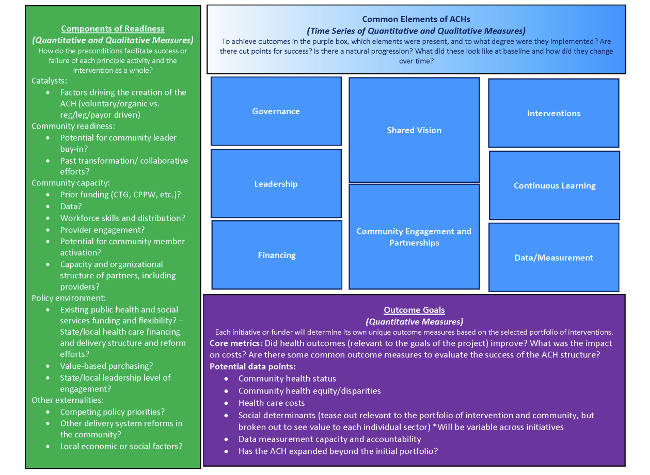
The Common Framework for Assessing Accountable Communities for Health (ACHs) helped us understand what is important in the context of ACHs and how they are expected to work.

Source: Levi et al., 2018,11 where ACHs navigate various components of readiness, share common elements, and work toward similar outcomes goals.


